Odds Aggregation Platforms Revolutionize How Bettors Worldwide Approach Wagering Choices
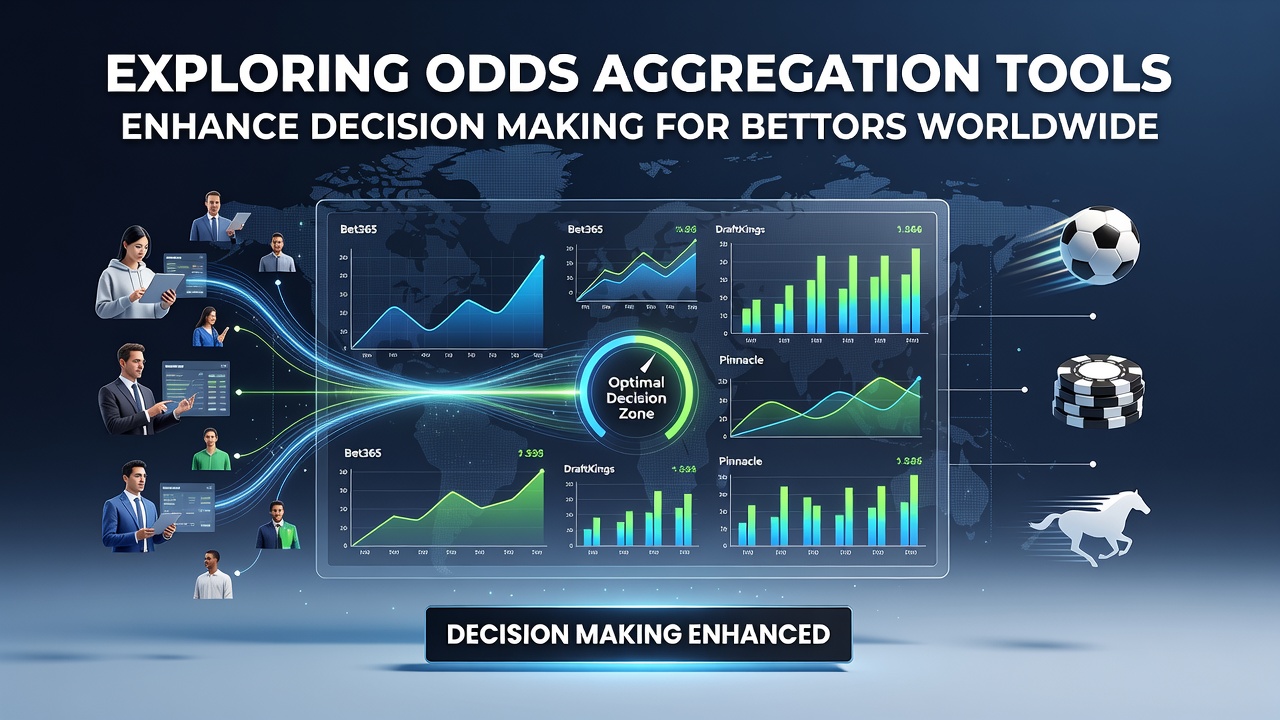
Odds aggregation tools compile betting lines from numerous operators into unified interfaces, which allows users to scan price variations across markets in real time without switching between separate platforms. Data from industry reports shows these systems pull feeds from dozens of licensed books simultaneously, presenting the highest and lowest available numbers for each selection so bettors can identify value discrepancies quickly.
Core Mechanics Behind Aggregation Systems
Modern platforms connect through application programming interfaces that refresh every few seconds, pulling decimal, fractional, and American formats while standardizing them for side-by-side comparison. Researchers at several European universities have documented how these engines apply algorithms to flag arbitrage opportunities when one book offers a line that diverges sharply from the consensus average across competitors.
Users receive alerts when movement exceeds predefined thresholds, and the same tools often layer in historical line movement charts so observers can track whether a number has drifted since opening. This combination of live feeds and archived data gives bettors a broader context for each market than any single operator can supply alone.
Decision Frameworks Supported by Aggregated Data
Bettors employ these resources to calculate implied probabilities across multiple sources and then cross-reference those figures against their own models. When one sportsbook lists a total at 2.5 while another sits at 2.75, the aggregation layer highlights the spread so users can choose the side that aligns with their calculated edge rather than accepting the first available price.
Studies conducted by academic teams in Australia and Canada indicate that frequent aggregation users adjust stake sizes more dynamically because they see the full range of available odds before committing funds. The tools also surface correlated markets, such as player props alongside team totals, which helps individuals construct multi-leg wagers with consistent pricing across books.
Regional Adoption Patterns Through Mid-2026
By July 2026 markets in North America, Europe, and the Asia-Pacific region had integrated aggregation services into both desktop and mobile interfaces at increasing rates. Regulatory filings from several Canadian provinces and Australian states show that operators now embed these comparison engines directly into their apps to retain users who might otherwise migrate to competing sites for better lines.

European operators report similar patterns, with aggregation features appearing in loyalty program dashboards that reward members for placing wagers at the best available odds identified through the tool. Observers note that this integration reduces the friction of shopping lines manually and keeps activity within a single ecosystem even when prices originate elsewhere.
Practical Examples From Different Markets
Take one researcher who tracked tennis markets during a major tournament and found that aggregation users captured an average price improvement of 4 to 6 percent compared with bettors who stayed with a single operator. In another instance, experts following football leagues across South America documented how live aggregation during matches allowed rapid repositioning when in-play lines diverged from pre-match consensus.
Those who have studied this know the pattern repeats across time zones because aggregation engines operate continuously, refreshing while users sleep so fresh discrepancies appear by morning. The ball stays in the bettor's court when the system surfaces a line that has moved but remains available at another book.
Integration With Risk Management Practices
Aggregation platforms frequently include exposure trackers that sum potential payouts across all open positions regardless of which operator hosts each bet. This consolidated view helps users maintain overall limits and avoid overexposure to correlated outcomes that might appear independent when viewed in isolation.
Data indicates that operators who supply aggregation feeds also receive reciprocal traffic, creating a feedback loop that benefits both the tool provider and the underlying sportsbooks. Industry organizations such as the European Gaming and Betting Association have published summaries showing how standardized data feeds support compliance reporting while delivering the comparison layer bettors expect.
Emerging Capabilities and Data Sources
Developers continue adding machine-learning layers that predict line movement based on historical patterns and current betting volumes, yet the core value remains the breadth of sources rather than predictive features alone. Government agencies in multiple jurisdictions, including those overseeing markets in New Zealand and several U.S. states, have begun requiring transparency around data sourcing so users understand which operators contribute to each aggregated view.
What's interesting is how these requirements have encouraged wider participation from smaller regional books, expanding the number of lines visible in any single search. The result is a denser market picture that reflects pricing from a broader cross-section of licensed operators than was common even two years earlier.
Conclusion
Odds aggregation tools function as centralized comparison layers that surface pricing differences across global operators, enabling bettors to align wagers with calculated edges rather than accepting isolated lines. Reports from regulatory bodies and academic groups confirm increased adoption through 2026, particularly where mobile interfaces embed these engines directly into the betting flow. The systems continue to evolve through API improvements and expanded source networks while maintaining the fundamental role of presenting the full spectrum of available odds in one location.