19 Aug 2026
Integrated Odds Tools Drive Shifts in Bettor Decision-Making Within Modern Ecosystems
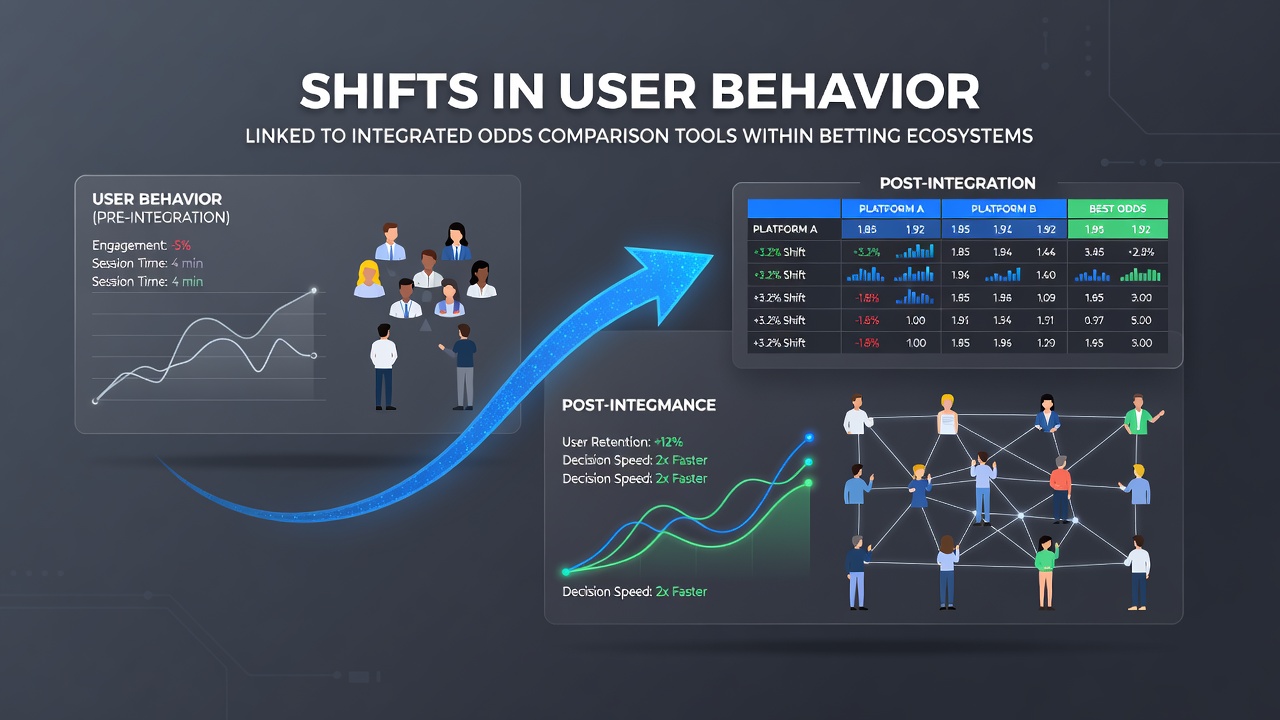
Integrated odds comparison tools have become standard features across many betting platforms, and data collected through 2026 reveals measurable changes in how users approach wagering decisions. These tools allow direct side-by-side evaluation of odds from multiple operators within a single interface, which alters the sequence of actions users take before placing bets. Researchers tracking platform analytics note that the presence of these features correlates with longer consideration periods and more frequent cross-checking of pricing before final selections occur.
Platform operators report that users equipped with comparison functions tend to evaluate a wider range of markets per session. Sessions that previously focused on one or two outcomes now often expand to include three or four additional lines because the tool reduces the friction of switching between separate sites. This pattern appears consistently in aggregated user flow data released by several major operators during the first half of 2026.
Patterns Emerging From Usage Data
Analytics from multiple ecosystems indicate that users who activate comparison tools show higher rates of bet modification before confirmation. Instead of committing quickly to an initial selection, individuals adjust stake amounts or switch selections when better odds appear within the integrated display. Operators in North American markets documented this adjustment behavior rising noticeably between January and August 2026 as more platforms rolled out the feature set.
Geographic differences surface in the data as well. Markets with established regulatory frameworks, such as those overseen by the Nevada Gaming Control Board, display steadier adoption curves compared with newer jurisdictions. Users in these regions appear more likely to incorporate the comparison step into their routine, while adoption in emerging markets remains more variable depending on device type and session length.
Impact on Session Duration and Market Exploration
Session length metrics reveal an interesting development. Although individual bet placement time increases slightly, overall time spent within the platform often extends because users explore additional markets once the comparison view is active. One industry report highlighted that average session duration grew by measurable margins in platforms that embedded these tools, particularly during high-profile events where multiple lines were available simultaneously.
Market exploration follows a similar trajectory. Data shows users accessing comparison views are more inclined to examine niche or secondary markets they might otherwise overlook. This behavior expands the distribution of wagers across a broader set of outcomes rather than concentrating activity on headline events. Observers tracking these trends point to the reduced effort required to scan odds as a contributing factor behind the shift.
Device-Specific and Demographic Variations
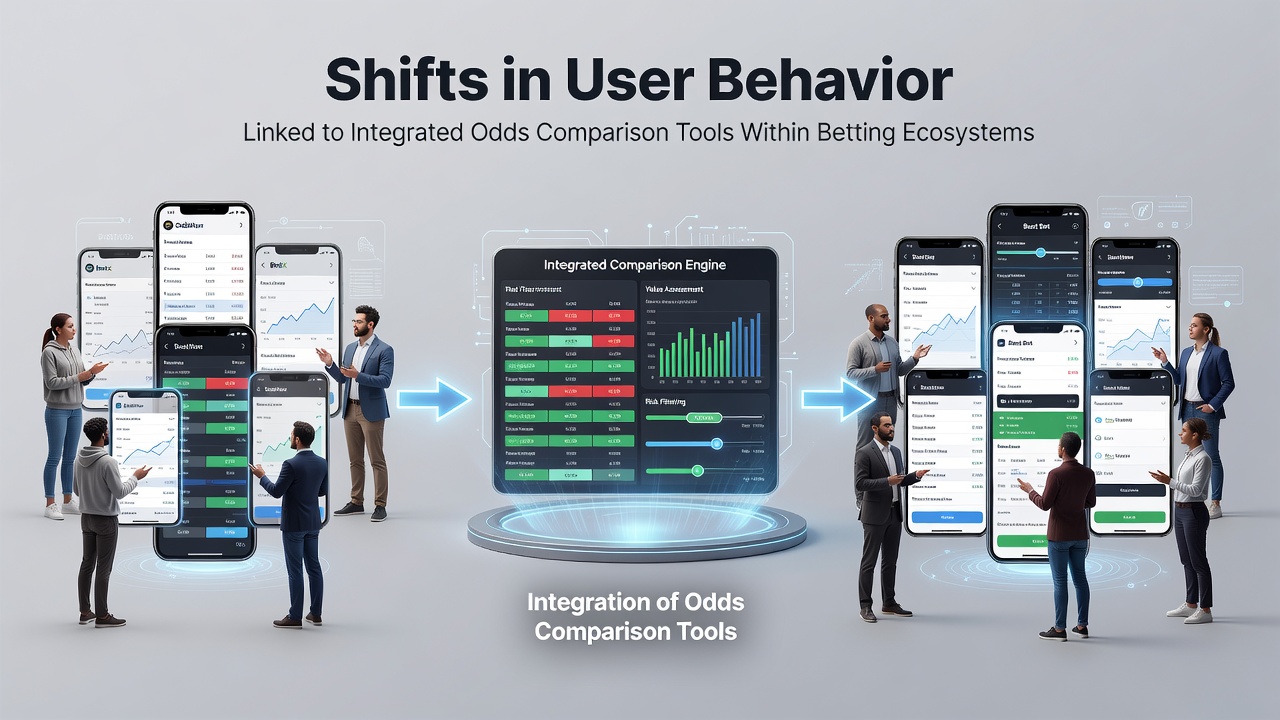
Mobile users demonstrate different interaction patterns than desktop users when comparison tools are available. Mobile sessions tend to feature quicker toggling between comparison and standard views, while desktop sessions allow longer side-by-side analysis. These distinctions appear in heat-map studies conducted by several platform providers throughout 2026.
Demographic breakdowns indicate younger user cohorts engage with the tools more frequently during initial platform visits. Older cohorts show slower uptake but demonstrate higher retention of the comparison step once they incorporate it into their process. Such differences align with broader technology adoption curves observed across digital services in regulated betting environments.
Regulatory bodies in multiple regions have begun incorporating these behavioral metrics into oversight discussions. The American Gaming Association published findings in mid-2026 that examined how transparency features influence user patterns without altering overall participation rates. Similar analyses from Canadian provincial regulators have examined comparable questions from a different regulatory perspective.
Platform Design Adjustments
Operators have responded to observed shifts by refining how comparison tools surface within the interface. Placement, default settings, and the number of providers included all receive ongoing calibration based on engagement metrics. These adjustments aim to maintain the utility of the feature while aligning with responsible gaming parameters established by licensing authorities.
Technical integration also influences outcomes. Platforms that load comparison data in real time report stronger user retention of the tool compared with those using cached or delayed feeds. The difference becomes particularly evident during live betting windows when odds fluctuate rapidly and users expect immediate updates.
Conclusion
Behavioral data collected through August 2026 demonstrates that integrated odds comparison tools produce consistent, measurable changes in how users interact with betting platforms. Longer evaluation periods, broader market exploration, and increased pre-bet adjustments appear across multiple jurisdictions and device types. As platforms continue refining these features, ongoing measurement will clarify the extent to which these shifts persist or evolve in subsequent periods.