22 Jul 2026
App Refresh Cadence and Satisfaction Metrics in Licensed Wagering Platforms
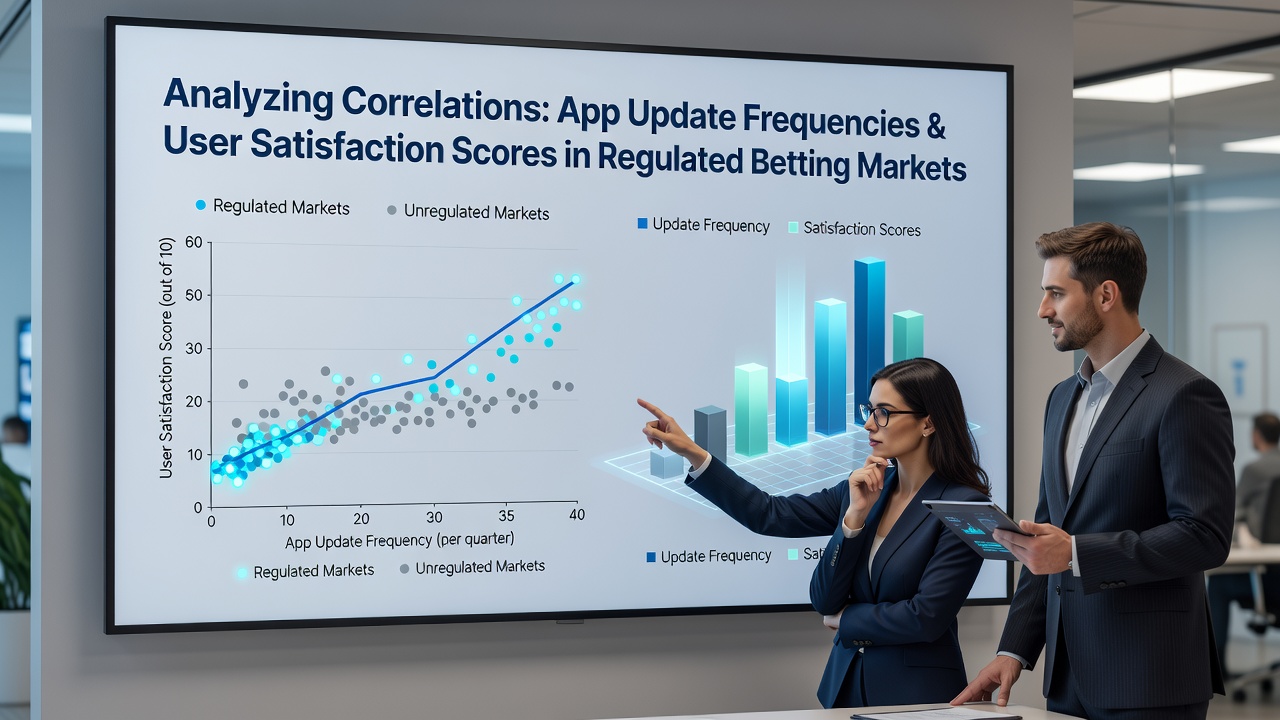
Analysts track update frequencies in regulated betting apps by counting releases per quarter, while user satisfaction emerges from aggregated ratings, review sentiment scores, and retention data pulled from app stores and operator dashboards. Data from multiple jurisdictions shows measurable patterns between these two variables, especially as mobile platforms dominate access to licensed wagering services. Recent figures compiled through July 2026 indicate operators in mature markets release updates between four and nine times annually, with satisfaction scores ranging from 3.8 to 4.6 on five-point scales.
Measurement Frameworks Used by Researchers
Teams compile update logs directly from public app store histories and cross-reference them with anonymized satisfaction indicators supplied by operators under regulatory reporting requirements. Observers note that satisfaction metrics often incorporate net promoter scores alongside star ratings, which creates a composite view of user sentiment. In practice, analysts segment data by operating system, device type, and feature categories such as live betting modules or account management tools, because update scope influences how users perceive each release.
Regulatory filings from several regions supply additional context, including mandatory disclosure of downtime during updates and post-release bug reports. Those datasets allow correlation models to control for external factors like promotional campaigns or major sporting events that might independently affect satisfaction.
Patterns Observed Across Markets
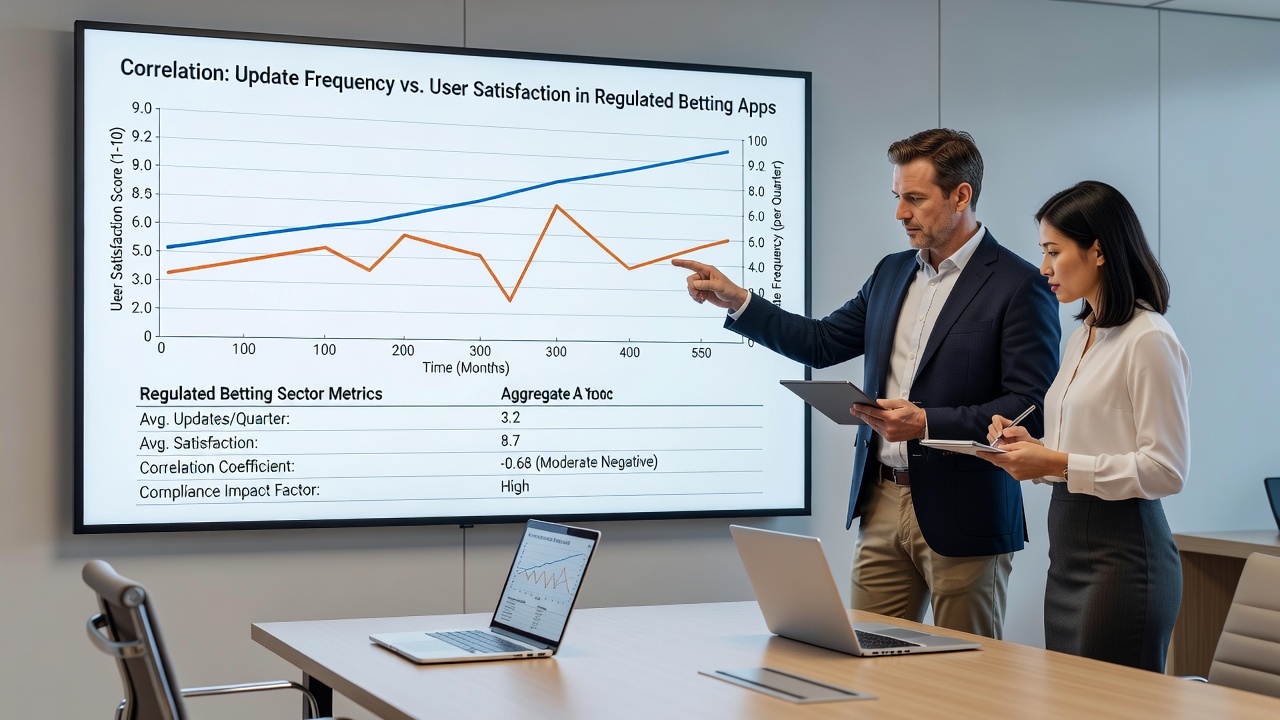
Evidence from North American and European operators reveals a positive correlation between moderate update frequency and higher satisfaction scores, although the relationship flattens after roughly seven releases per year. Platforms that push updates more often than that threshold sometimes record slight dips in satisfaction, particularly when changes affect core betting flows without clear user benefit. One study covering 2025 and early 2026 found operators averaging five updates achieved average satisfaction of 4.3, whereas those exceeding eight updates hovered near 4.1.
What's interesting is that the type of update matters as much as the count. Releases focused on security patches or regulatory compliance tend to correlate with stable or improved scores, while feature-heavy updates occasionally produce mixed results until users adapt. Data from the Nevada Gaming Control Board shows that apps undergoing frequent compliance-driven updates maintained higher retention through the first half of 2026 compared with those emphasizing interface redesigns.
Regional Variations and Regulatory Influence
Markets with stricter change-control rules, such as those overseen by the Malta Gaming Authority, display tighter clustering of update frequencies around six releases annually, accompanied by satisfaction scores that remain consistently above 4.2. In contrast, jurisdictions allowing faster iteration sometimes see wider variance in both metrics. Australian operators, guided by requirements from the Australian Communications and Media Authority, tend to bundle multiple improvements into fewer releases, which aligns with satisfaction data that peaks when updates address accumulated user feedback rather than incremental tweaks.
July 2026 data releases from several operators further highlight that markets experiencing rapid regulatory shifts, including new responsible gambling tools, record temporary satisfaction dips during transition periods even when update counts remain steady. Those dips typically recover within two quarters once users integrate the changes.
Case Examples From Licensed Operators
One mid-sized operator in a U.S. state increased its update cadence from four to six releases in 2025 after internal analysis linked prior lower frequency to rising support tickets. Satisfaction scores rose from 4.0 to 4.4 within nine months, according to internal dashboards shared with regulators. Another platform in a Canadian province maintained seven updates per year but shifted focus toward performance optimizations, which correlated with a 12 percent reduction in negative reviews during the same period.
Researchers at institutions examining digital wagering have noted similar trends when examining aggregated store data across hundreds of apps. Their models suggest that the correlation coefficient between update frequency and satisfaction reaches approximately 0.65 before plateauing, indicating a meaningful but not deterministic relationship.
Conclusion
Correlations between app update frequencies and user satisfaction scores in regulated betting markets rest on observable data patterns rather than isolated anecdotes. Moderate release cadences paired with targeted improvements tend to align with stronger satisfaction indicators, while excessive frequency or poorly scoped changes show weaker or negative associations. Regulatory environments shape these dynamics by influencing how quickly operators can iterate, and ongoing monitoring through mid-2026 continues to refine understanding of these relationships across jurisdictions.